Design philosophy
The Quartr API is built around a simple idea: keep data in small, focused components rather than bundling everything into monolithic responses. An earnings call produces many types of content (audio recordings, transcripts, slide decks, financial reports, and AI-generated summaries), but you probably don’t need all of them. By separating these into distinct datasets, you only fetch and pay for the data you actually use. This modular approach also means each component can follow its own lifecycle. A slide deck might be published hours before an earnings call starts. The live audio stream begins the moment the call goes live. The transcript is generated after the call concludes. Rather than waiting for everything to be ready before surfacing any of it, each dataset becomes available as soon as it exists, and you can consume them independently or combine them as needed.How the data fits together
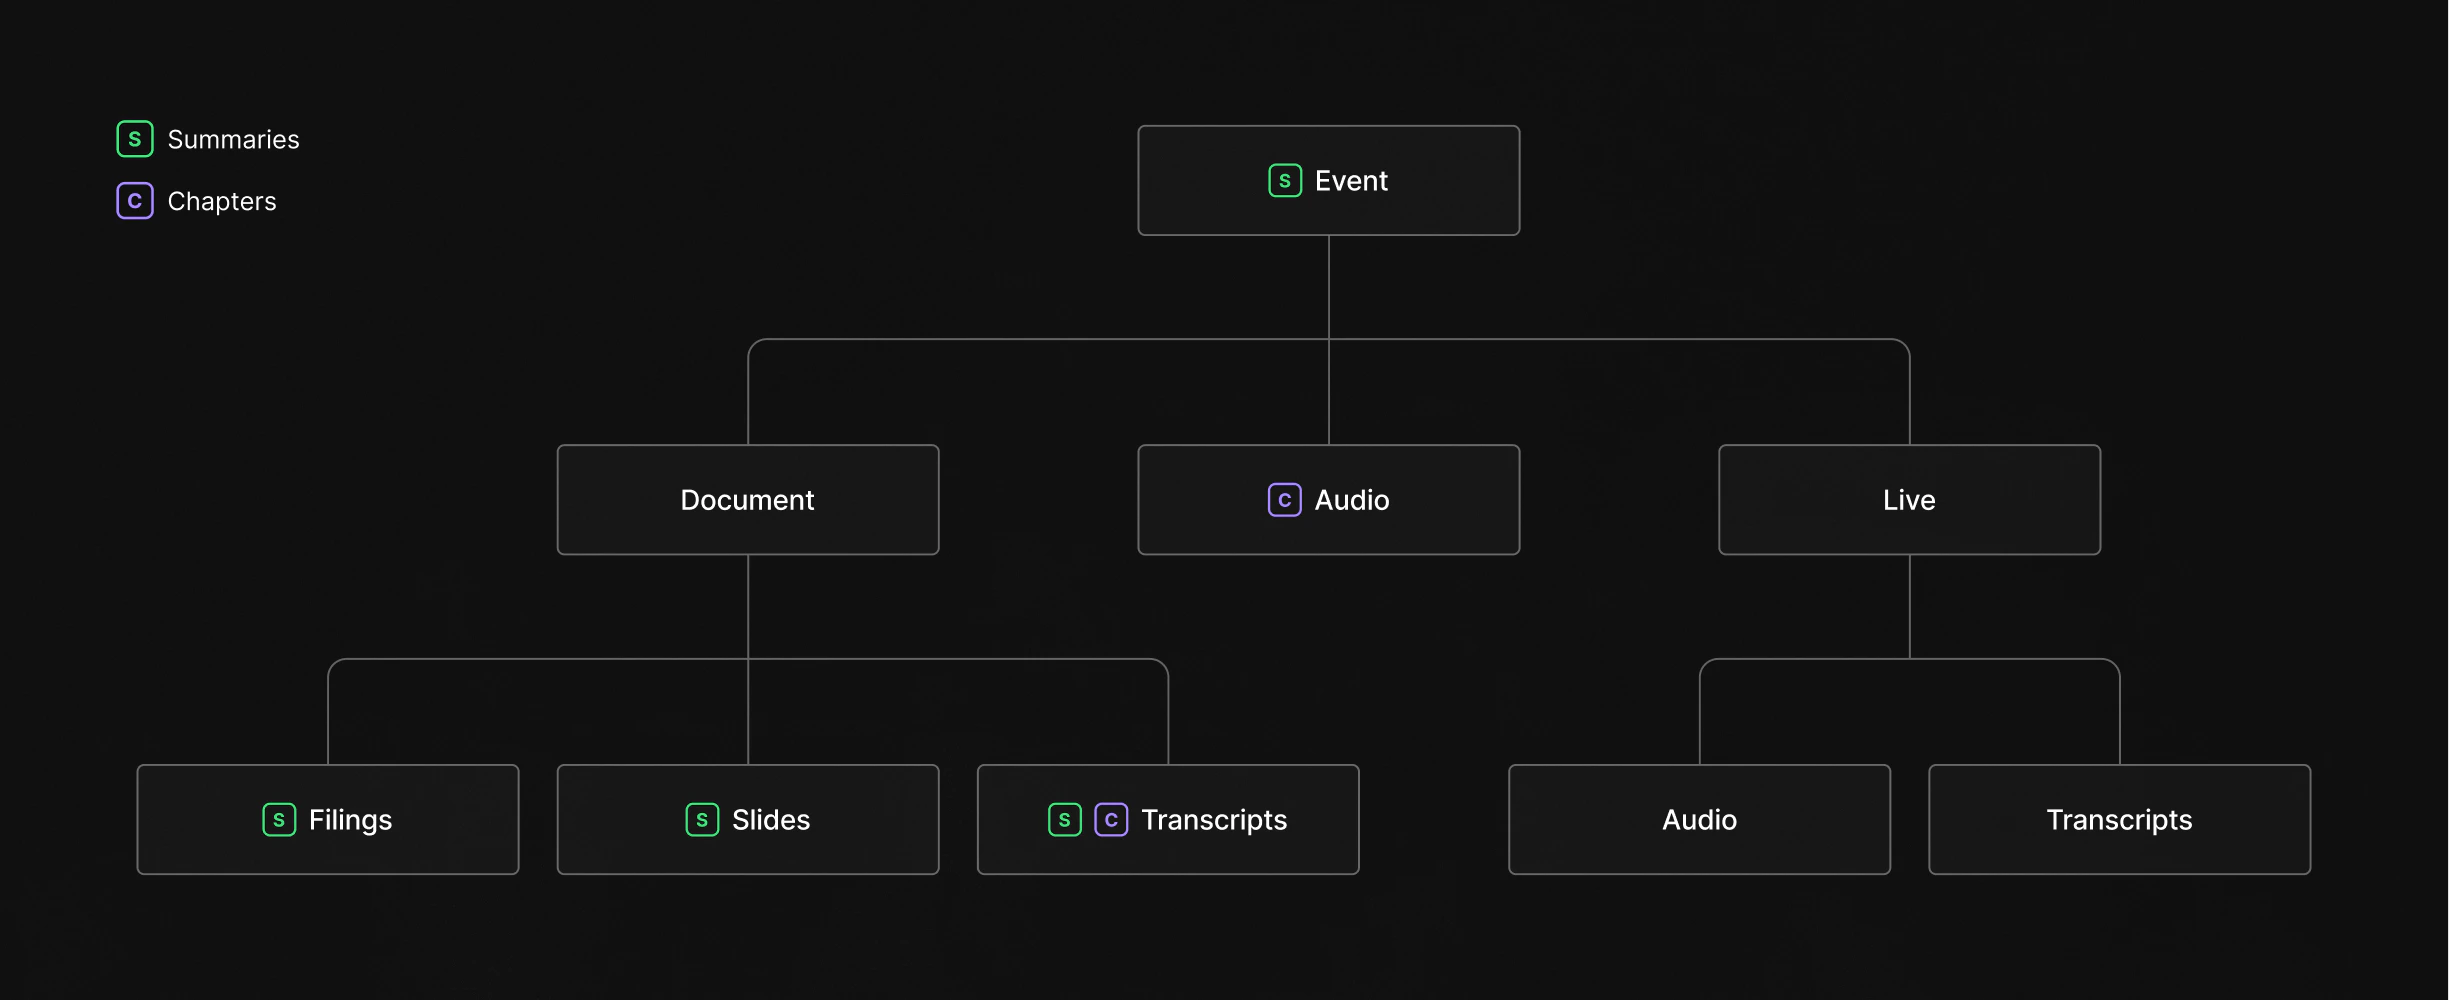
Everything in the API flows through a three-level hierarchy: companies own events, and events contain content.Companies
A company is the top-level entity. It represents a single publicly listed company and serves as the anchor for everything else. Every piece of content in the API traces back to a company through itscompanyId. Companies carry metadata like name, country, and multiple identifiers (tickers, ISINs, CIKs) that let you match them across systems.
Events
Events are the organizing layer. Each event represents something that happened for a company: a quarterly earnings call, a capital markets day, an M&A announcement, a conference appearance. Events carry metadata like title, date, and type, and they act as containers that group all related content together. A single company will have many events over time, but each event belongs to one company. Think of an event as a folder. When Apple holds its Q3 earnings call, that event becomes the central node linking together the accompanying slide deck, the financial report, the audio recording of the call, and the transcript that follows.Content
Beneath each event sits the actual content, split into distinct datasets that you can access independently: Documents include reports, transcripts, and slide decks, each with a type identifier that tells you exactly what it is. A quarterly earnings report is a different document type than a 10-K filing or a conference slide deck, and you can filter by type to retrieve only what matters to your use case. Audio captures the recorded call itself, available in both streaming (M3U8) and download (MPEG) formats. If you’re building a playback experience, you get both options. If you only need the raw file for processing, the download URL is all you need. Live data covers the real-time layer. When an event is happening right now, you can tap into the live audio stream and the live transcript as it’s being generated. This data is also retained historically, so the same endpoints work whether you’re consuming a call as it happens or reviewing one from last quarter. Chapters provide structured navigation within audio and transcript content. They break a long earnings call into labeled segments (prepared remarks, Q&A, specific financial topics) with timestamps that let you jump directly to the section you care about. Summaries sit on top of everything else. They’re AI-generated overviews available at both the document level (summarize a single slide deck) and the event level (synthesize across all documents for a holistic view). Summaries come in three lengths (a one-liner, a short paragraph, and a detailed breakdown) and include source references that link back to the original content.Data availability
Each dataset follows its own timeline from real-world event to API availability. These SLAs are contractual commitments:| Dataset | SLA |
|---|---|
| Live content | 90% streamed and transcribed within 5 seconds of event start |
| Transcripts | Available for 95% of events within 45 minutes after conclusion |
| Audio recordings | Available for 90% of events within 20 minutes after conclusion |
| Filings and reports | Available for 90% within 15 minutes of public release |
| Edited transcripts | Available within a couple of hours after conclusion |
| Slide presentations | Available for 90% of events within 30 minutes of public release |
Data freshness
How quickly you receive new data depends on how you consume it. The REST API reflects changes the moment they’re processed. You can poll endpoints on a schedule or subscribe to webhooks to get notified within seconds of new content being available. Both approaches give you access to the same data; webhooks simply eliminate the delay between updates and your next poll. Snowflake shares are refreshed daily.Timestamps and pagination
All list endpoints share the same approach to timestamps, pagination, and filtering. See fetching data for details on how cursor-based pagination works, whatupdatedAt and createdAt mean, and how to use common query parameters like updatedAfter, companyIds, and date ranges.